
.svg)

TL;DR:
- CPA measures campaign efficiency but must be interpreted alongside customer lifetime value for true success.
- Accurate CPA calculation requires defining conversions, including all related costs, and using appropriate attribution models.
- Chasing low CPA alone can harm long-term revenue; align targets with LTV and focus on maximizing quality.
Most enterprise marketers can recite the CPA formula without hesitation. Fewer can tell you whether their CPA is actually good. Cost per acquisition measures the total cost of acquiring one conversion through a specific campaign or channel, but the real challenge isn’t the math. It’s knowing what to do with the number. Many teams conflate CPA with customer acquisition cost, optimize toward the wrong target, or chase a lower CPA while quietly destroying lead quality. This guide cuts through the confusion, gives you a clear framework for measuring and interpreting CPA, and shows you how to use it as a genuine lever in your growth machine.
Table of Contents
- Defining cost per acquisition and its marketing impact
- CPA vs. CAC: Clearing up common confusion
- How to calculate CPA for clarity and action
- Benchmarks and optimization: What is a ‘good’ CPA in 2026?
- Expert frameworks for optimizing CPA at scale
- Our perspective: The uncomfortable truth about CPA in enterprise marketing
- Get help optimizing your CPA—see the difference
- Frequently asked questions
Key Takeaways
| Point | Details |
|---|---|
| CPA definition clarified | Cost per acquisition measures how much you pay for each conversion from a specific campaign or channel. |
| CPA vs. CAC matters | Understanding the difference between CPA and CAC prevents budgeting errors and enables smarter channel choices. |
| Benchmarks provide targets | Knowing industry-specific CPA benchmarks helps set realistic goals and judge campaign efficiency. |
| Optimize for value, not just cost | Prioritize the quality of conversions and a strong LTV:CPA ratio over chasing the lowest CPA. |
Defining cost per acquisition and its marketing impact
At its core, CPA tells you how efficiently your campaigns convert spend into action. The CPA formula is straightforward: Total Campaign Cost divided by Number of Conversions. If you spent $10,000 and generated 200 leads, your CPA is $50. Clean and simple, right? The complexity enters when you define what counts as a conversion and what counts as a cost.
A “conversion” isn’t universal. For an ecommerce brand, it’s a purchase. For a B2B SaaS company, it might be a demo request, a free trial signup, or a qualified lead passed to sales. Each definition produces a different CPA, and comparing them across business models is like comparing apples to turbines.
What to include in your cost calculation matters just as much:
- Media spend (what you actually pay the platform)
- Agency or management fees (retainer or performance-based)
- Creative production costs (video, copy, design)
- Platform and tool fees (attribution software, analytics subscriptions)
- Landing page development or testing costs
Leave any of these out and your CPA is understated, which leads to overconfident budget decisions.
Here’s a snapshot of where CPA benchmarks typically land across channels and industries, based on 2026 data:
| Channel / Industry | Avg. CPA |
|---|---|
| Google Ads, Retail | ~$17 |
| Google Ads, Healthcare | ~$37 |
| Google Ads, SaaS / Technology | ~$78 |
| Google Ads, Professional Services | ~$17 |
| Meta Ads, Ecommerce | ~$30–$55 |
| Google Ads, Cross-industry avg. | ~$45–$70 |
These figures give you a baseline, but context is everything. A $78 CPA for a SaaS product with a $12,000 annual contract value is outstanding. The same CPA for a $29 product is a disaster. Understanding what PPC bidding means at the platform level helps you see why CPA varies so dramatically based on auction dynamics, audience quality, and intent signals.
With foundational concepts in place, it’s critical to distinguish CPA from its often-confused counterpart, CAC.
CPA vs. CAC: Clearing up common confusion
This is where even experienced marketing teams go sideways. CPA and CAC sound interchangeable. They are not.
CPA differs from CAC in a fundamental way: CPA is campaign-level and conversion-specific, while CAC is a business-level metric that captures every dollar spent to acquire a paying customer, including salaries, tools, events, and overhead.
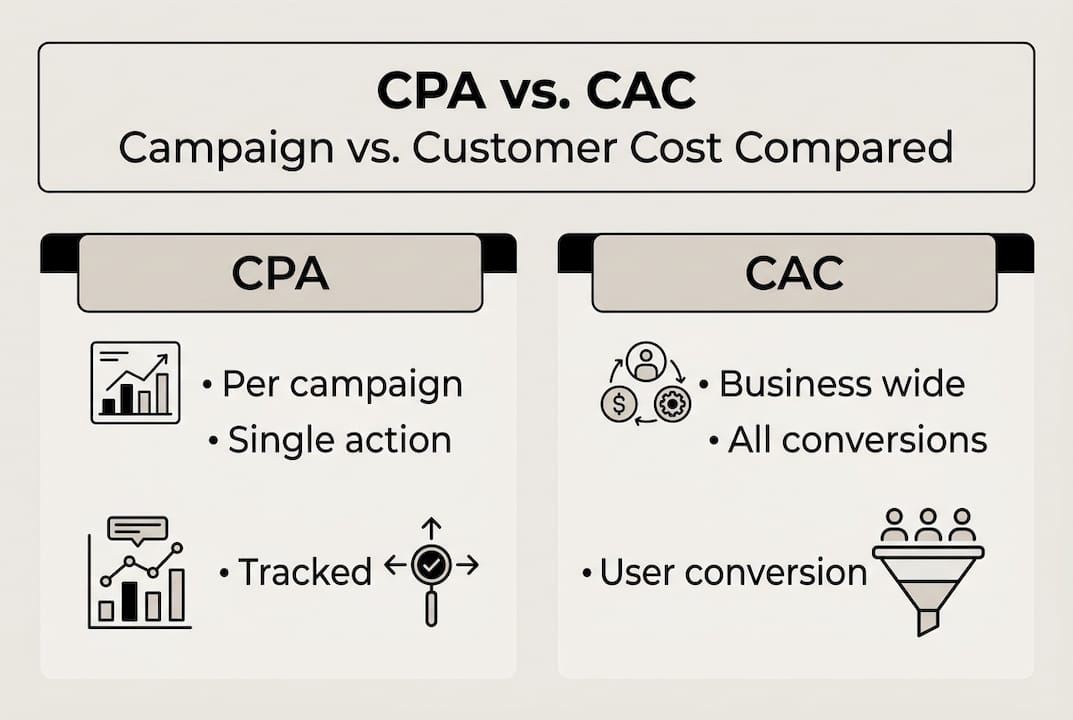
| Metric | Scope | Costs Included | Primary Use Case |
|---|---|---|---|
| CPA | Single campaign or channel | Media spend, creative, fees | Campaign optimization, channel comparison |
| CAC | Entire business | All sales and marketing costs | Financial modeling, unit economics, investor reporting |
When to use each:
- Use CPA when evaluating campaign performance, comparing channels, or optimizing bids
- Use CAC when assessing overall business health, forecasting, or making hiring decisions
- Pitfall: Reporting CPA to your CFO as if it represents total acquisition cost will produce flawed financial models and misaligned budget expectations
- Pitfall: Using CAC to make day-to-day bidding decisions introduces too much noise from non-media variables
Mixing these two metrics in reporting is one of the most common sources of misalignment between marketing and finance teams. When your VP of Finance asks what it costs to acquire a customer and you hand them a campaign-level CPA, you’re answering a different question than the one being asked.
The fix is definitional clarity. Align with your analytics and finance teams on what each metric means before any reporting cycle begins. This sounds obvious, but in practice, it rarely happens without someone pushing for it.
Pro Tip: Document your CPA and CAC definitions in a shared metrics glossary. When everyone is measuring the same thing, profit-based bidding decisions become far more defensible and actionable across departments.
Understanding the strategic distinction, the next step is knowing how to calculate CPA correctly for actionable insight.
How to calculate CPA for clarity and action
The formula is easy. The execution is where most teams stumble. Here’s a step-by-step process that works at enterprise scale:
- Define your conversion event clearly. Is it a lead form submission, a purchase, a phone call, a demo booking? Document this before you touch any data.
- List every cost associated with the campaign. Ad spend, creative fees, agency costs, platform subscriptions, and any testing infrastructure.
- Aggregate your totals for the measurement period. Make sure your date ranges align across platforms and your attribution window is consistent.
- Divide total cost by total conversions to get your CPA. Then segment by channel, audience, device, and creative to identify where efficiency lives.
Attribution is where the real complexity surfaces. Single-touch attribution, giving all credit to either the first or last click, distorts CPA in multi-channel environments. Ignoring multi-touch attribution leads to systematic misallocation of budget, where channels that assist conversions get defunded and the last-click channel gets over-invested.
For enterprise teams running campaigns across Google, Meta, programmatic, and email simultaneously, a data-driven or position-based attribution model gives a far more accurate picture of true CPA per channel.
Pro Tip: In a privacy-first measurement environment where cookies and pixel data are increasingly unreliable, blended CPA (total spend divided by total conversions across all channels) is your most stable north star metric for budget-level decisions.
Low CPA isn’t always better. A $20 CPA that brings in low-intent users who churn in 30 days is far more expensive than a $90 CPA that delivers customers with a 3-year lifetime value. Always evaluate CPA in the context of LTV, and aim for an LTV:CPA ratio that actually builds a business.
For teams focused on optimizing ad campaigns for ROI, this LTV lens is non-negotiable. And if you’re leaning on platforms to automate your bids, understanding Google’s automated bidding mechanics will help you set smarter targets.
Now that you know how to accurately measure CPA, the real advantage appears when applying CPA benchmarks and optimization.
Benchmarks and optimization: What is a ‘good’ CPA in 2026?
Benchmarks are a starting point, not a finish line. Here’s where 2025 Google Ads CPA benchmarks land by industry: Retail at roughly $17, Healthcare near $37, and Technology or SaaS reaching $78. Across all industries, the average sits between $45 and $70.

| Channel | Industry | Avg. CPA 2026 |
|---|---|---|
| Google Ads | Retail | ~$17 |
| Google Ads | SaaS | ~$78 |
| Google Ads | Healthcare | ~$37 |
| Meta Ads | Ecommerce | ~$30–$55 |
| Meta Ads | B2B Lead Gen | ~$60–$100 |
Beyond the number itself, several factors shape whether your CPA is healthy:
- Audience quality: Broad audiences lower CPA but often reduce conversion quality
- Attribution model: Last-click inflates certain channels; data-driven gives a truer picture
- Device mix: Mobile typically drives higher CPAs in B2B due to lower intent and conversion friction
- Creative fatigue: Stale ads inflate CPAs faster than most teams realize
If your CPA is trending up, diagnose before you optimize. Ask: Is CPM rising (audience saturation)? Is CTR falling (creative fatigue)? Is CVR dropping (landing page or offer mismatch)? Each root cause requires a different fix.
Tactics that reliably reduce CPA without sacrificing quality:
- Refresh creative every 4 to 6 weeks to combat fatigue
- Tighten landing page alignment with ad messaging
- Use Target CPA bidding with sufficient conversion volume (50+ conversions per month minimum)
- Exclude low-quality placements, audiences, and search terms
- Run structured A/B tests on offers, headlines, and calls to action
For enterprise teams, the LTV:CPA ratio of 3:1 is the standard benchmark for a sustainable campaign. If your CPA is $100 but your average customer LTV is $400, you’re in excellent shape. Comparing your results against Google Ads vs. ChatGPT Ads ROI can also reveal where your budget works hardest in 2026. Pair that with advanced bid management to stay ahead of platform algorithm shifts.
Benchmarks provide perspective, but true optimization comes from applying expert-level frameworks in the context of 2026 enterprise marketing.
Expert frameworks for optimizing CPA at scale
Once you’ve nailed measurement and benchmarking, the next level is systematic optimization. This is where enterprise teams separate from the pack.
Start by decomposing CPA into its component metrics: CPM (cost per thousand impressions), CTR (click-through rate), and CVR (conversion rate). Your CPA is a product of all three. A high CPA caused by poor CVR requires a different response than one caused by high CPM. Treating them the same wastes time and budget.
Creative refreshes alone can drive 30 to 50% CPA improvement when audience saturation and creative fatigue are the root cause. This is one of the most underutilized levers in enterprise advertising, largely because creative production cycles are slow and organizational inertia is real.
Here’s a practical framework for scaling CPA optimization:
- Implement negative keyword and audience exclusions to eliminate wasted spend at the entry point
- Build lookalike audiences from your highest-LTV customer segments, not just converters
- Shift to value-based bidding when order values or lead quality vary significantly across segments
- Consolidate ad sets and campaigns to give platform algorithms more data per unit and improve learning efficiency
- Establish a creative testing cadence with clear success metrics before launching any new asset
Pro Tip: Value-based bidding consistently outperforms standard Target CPA bidding in environments where conversion value varies. If you’re selling products at $50 and $500, telling the algorithm to optimize for value rather than volume is the smarter play.
Knowing when to trust AI for PPC bid optimization and when to intervene manually is a skill that compounds over time. And when creative is the bottleneck, working with a team that knows how to refresh your creative systematically makes a measurable difference.
Companies who shift from theory to disciplined, data-informed execution maximize ROI quickly, a subject we have seen proven repeatedly.
Our perspective: The uncomfortable truth about CPA in enterprise marketing
Here’s something we’ve seen play out more times than we’d like: a marketing team hits their CPA target, celebrates the efficiency win, and then watches revenue flatline. Why? Because they optimized for the metric instead of the outcome.
Chasing the lowest possible CPA is a trap. It rewards volume over value, and in enterprise environments, that trade-off quietly erodes customer quality, sales cycle efficiency, and long-term revenue. We’ve worked with teams running campaigns that generated leads at $15 CPA, only to find that none of those leads were closing. Meanwhile, a parallel campaign with a $90 CPA was producing customers with 4x the lifetime value.
The real work is aligning your CPA targets with your actual business model. That means knowing your LTV, your close rate, and your average deal size before you set a single bid. PPC ROI strategies that ignore these inputs are just guessing with a budget. The teams that win are the ones who treat CPA as one signal in a larger system, not the finish line.
Get help optimizing your CPA—see the difference
If this framework resonates but execution feels like the hard part, that’s exactly where we come in. At AdVenture Media, we’ve engineered campaigns that deliver measurable CPA improvements by combining data-driven bidding, rigorous creative testing, and conversion-focused strategy. Our work on creative-driven CTR improvement shows what’s possible when creative and performance strategy align. And our case study on conversion growth demonstrates how sustained optimization compounds over time. If you’re ready to move from benchmarks to results, contact our experts and let’s build a CPA strategy that actually moves your business forward.
Frequently asked questions
What costs are included in cost per acquisition calculations?
Include all direct campaign costs such as ad spend, creative, agency fees, platform fees, and analytics tools. Leaving any of these out understates your true CPA and leads to overconfident budget decisions.
What is a good benchmark for CPA?
It depends heavily on your industry: retail averages ~$17 while SaaS can reach $78 or more. The more reliable benchmark is an LTV:CPA ratio above 3:1 regardless of the absolute number.
How does CPA differ from CAC?
CPA measures campaign-level efficiency for a single conversion type, while CAC includes all sales and marketing expenses to acquire a paying customer. Using them interchangeably creates serious misalignment between marketing and finance.
How can you lower CPA without hurting lead quality?
Focus on creative refreshes, landing page optimization, and tighter audience targeting rather than simply cutting bids. Reducing CPA through quality improvements sustains performance; reducing it by lowering standards just shifts the problem downstream.
Recommended


166% Revenue Increase for Hanes Brand with Segmented B2B / B2C Strategy


Global Fintech App Uses Automation To Profitably Grow Customer Base


Baketivity YoY Growth Soars after Analyzing Customer LTV's
Request A Marketing Proposal
We'll get back to you within a day to schedule a quick strategy call. We can also communicate over email if that's easier for you.
Visit Us
New York
1074 Broadway
Woodmere, NY
Philadelphia
1429 Walnut Street
Philadelphia, PA
Florida
433 Plaza Real
Boca Raton, FL
General Inquiries
info@adventureppc.com
(516) 218-3722
AdVenture Education
Over 300,000 marketers from around the world have leveled up their skillset with AdVenture premium and free resources. Whether you're a CMO or a new student of digital marketing, there's something here for you.
OUR BOOK
We wrote the #1 bestselling book on performance advertising
Named one of the most important advertising books of all time.
buy on amazon
OUR EVENT
DOLAH '24.
Stream Now.
Over ten hours of lectures and workshops from our DOLAH Conference, themed: "Marketing Solutions for the AI Revolution"
check out dolah
The AdVenture Academy
Resources, guides, and courses for digital marketers, CMOs, and students. Brought to you by the agency chosen by Google to train Google's top Premier Partner Agencies.
Bundles & All Access Pass
Over 100 hours of video training and 60+ downloadable resources
 view bundles →
.png)


