
.svg)

TL;DR:
- Focus on a few core metrics aligned with business objectives to drive effective decision-making.
- Implement a structured, repeatable system for metric analysis and review to ensure consistent insights.
- Prioritize simplicity and ownership in metrics to accelerate actions and improve growth outcomes.
Imagine you just wrapped a quarter where every dashboard showed green. Clicks up. Impressions up. Engagement through the roof. Then the revenue report lands, and the numbers tell a completely different story. That is the trap too many enterprise marketing teams fall into: mistaking activity for progress. Misreading marketing metrics doesn’t just stall growth, it actively redirects budget toward the wrong levers. This guide walks you through selecting the right metrics, building a repeatable analysis system, integrating the right tools, and translating benchmarks into confident action. No guesswork. No vanity wins.
Table of Contents
- Understanding which metrics move the needle
- Building a systematic framework for metric analysis
- Picking and integrating the right tools
- Putting it all together: Interpreting, benchmarking, and acting on data
- The uncomfortable truth about marketing metrics: less is often more
- Accelerate your results with expert marketing analysis
- Frequently asked questions
Key Takeaways
| Point | Details |
|---|---|
| Prioritize impact metrics | Direct your focus on 5–10 core metrics tightly linked to your strategic goals for the biggest business impact. |
| Build repeatable systems | Develop a six-step framework to ensure consistent, actionable marketing analysis and stakeholder buy-in. |
| Benchmark for clarity | Compare your numbers against reliable 2026 industry benchmarks to spot gaps and set realistic targets. |
| Automate and visualize | Use integrated analytics and automation platforms to streamline tracking and present insights clearly. |
| Less is more | Tracking fewer, more meaningful metrics leads to sharper insights and better decisions than drowning in data. |
Understanding which metrics move the needle
Not every number on your dashboard deserves your attention. That sounds obvious, but inside a large enterprise with multiple channels, stakeholders, and campaigns firing simultaneously, the pull toward tracking everything is real. Resist it. Focused measurement outperforms exhaustive measurement every time.
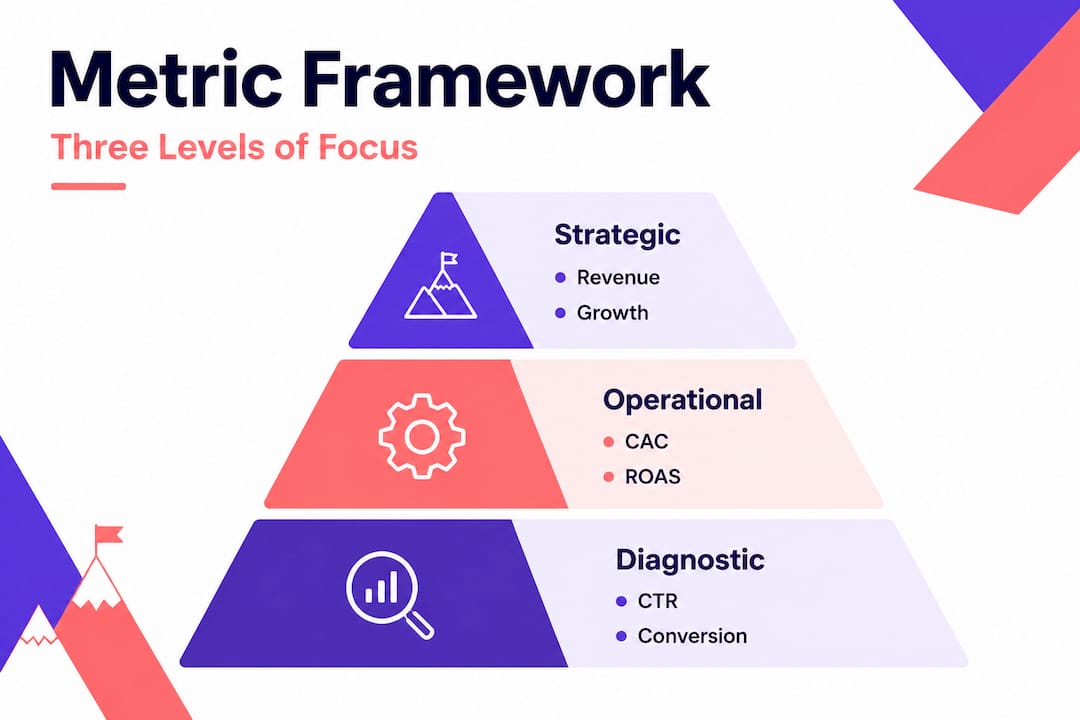
The first move is separating your metrics into three tiers. Strategic metrics reflect the overall health of your marketing investment: Customer Acquisition Cost (CAC), Customer Lifetime Value (LTV), Return on Marketing Investment (ROMI), Return on Ad Spend (ROAS), Marketing Efficiency Ratio (MER), and incremental ROAS (iROAS). These connect directly to board-level decisions. Operational metrics manage day-to-day execution: cost per click (CPC), click-through rate (CTR), conversion rate, and MQL-to-SQL (Marketing Qualified Lead to Sales Qualified Lead) rates. Diagnostic metrics like scroll depth, heat map engagement, and time-on-page help you troubleshoot the “why” behind drops in performance.
A well-designed metrics framework focuses on 5 to 10 core metrics tiered across strategic, operational, and diagnostic layers, while actively avoiding vanity metrics that feel good but don’t inform decisions.
The LTV to CAC ratio is one of the clearest signals of sustainable growth. A healthy ratio sits at 3:1 or higher. If you’re spending $702 to acquire a single B2B SaaS customer (the current median), your LTV needs to be comfortably above $2,100 to keep the engine running efficiently. Anything lower and you’re essentially paying to shrink. Check out our guide on essential marketing metrics to see which six numbers we believe every performance-focused team must own.
Vanity metrics are seductive because they’re easy to produce. High follower counts, raw impressions, and total page views feel like momentum. But none of them tell you whether a customer converted, whether a lead was qualified, or whether you’d make more money allocating that same budget elsewhere. The comparison below makes this distinction clear.
| Vanity metric | Actionable alternative |
|---|---|
| Total impressions | Impressions by audience segment with CTR |
| Social followers | MQL-to-SQL conversion rate |
| Page views | Revenue per visitor |
| Email list size | Email-attributed pipeline value |
| Video views | View-through conversion rate |
For enterprise marketing strategies to deliver real ROI, the metrics guiding them must connect directly to revenue outcomes. Period.
Pro Tip: Before your next planning cycle, ask this about every metric on your current dashboard: “If this number moved 20% in the wrong direction, would we change a budget decision?” If the answer is no, remove it.
Building a systematic framework for metric analysis
Choosing the right metrics is step one. Analyzing them consistently is where most enterprise teams lose the plot. Without a structured framework, you end up with ad hoc reporting, conflicting interpretations, and a leadership team making decisions from different versions of the truth.
Building a repeatable metrics system follows six clear steps. Follow them in order and you’ll create something the entire organization can trust.
- Define your business objectives first. Not marketing objectives. Business objectives. Revenue targets, retention goals, market share ambitions. Every metric you track must be a direct proxy for one of these.
- Map metrics to goals across five categories. Awareness, engagement, conversion, revenue, and retention. Each category should have at least one lead metric and one lag metric to capture both activity and outcome.
- Select integrated analytics platforms. Your tools need to talk to each other. Siloed data produces siloed decisions. More on platform selection in the next section.
- Automate your tracking. Manual reporting is slow, error-prone, and eats analyst time that should be spent on interpretation, not data entry.
- Design dashboards for specific stakeholders. A CMO dashboard looks nothing like a paid media manager’s dashboard. Tailor views to decision-making needs, not to what’s easy to export.
- Establish review rhythms. Building this metrics system in six structured steps only works if reviews actually happen on schedule. Set weekly performance check-ins, monthly goal reviews, and quarterly strategic audits.
The table below maps common business goals to recommended primary and secondary metrics.
| Business goal | Primary metric | Secondary metric |
|---|---|---|
| Grow new customer revenue | CAC, ROAS | MQL-to-SQL rate |
| Improve retention | Customer retention rate | LTV |
| Increase brand awareness | Branded search volume | Share of voice |
| Maximize ad efficiency | MER, iROAS | CPC, CTR |
| Accelerate pipeline velocity | MQL-to-SQL rate | Sales cycle length |
One rule that consistently improves team focus: limit yourself to no more than 2 to 3 primary metrics per objective. More than that and you create the conditions for analysis paralysis, where teams spend meetings debating numbers instead of taking action.
Regular review rhythms also keep the team aligned. When everyone checks the same metrics on the same schedule, interpretations converge and decisions accelerate. Effective enterprise KPI tracking isn’t about how many numbers you monitor. It’s about how consistently and collaboratively you act on them. For measurable strategy examples that put this framework into practice, we’ve documented the approaches that have worked for brands we’ve scaled.

Picking and integrating the right tools
A great framework without the right tooling is a strategy without execution. The good news: the enterprise analytics landscape in 2026 offers genuinely powerful options. The challenge is connecting them without creating a data swamp.
When evaluating platforms, look for three non-negotiables: real-time data access, cross-channel attribution, and stakeholder-ready reporting. Here’s how the leading options stack up.
| Platform | Core strength | Best for | Weakness |
|---|---|---|---|
| Google Analytics 4 (GA4) | Web and app tracking, event modeling | Mid-market to enterprise | Limited multi-channel attribution depth |
| Adobe Analytics | Advanced segmentation, enterprise scale | Large enterprise with IT support | High implementation cost and complexity |
| Looker (Google Cloud) | Custom BI dashboards, SQL-native | Data-mature teams | Requires engineering resources |
| Custom data warehouse (e.g., Snowflake + dbt) | Fully flexible, owns all data | Enterprises with dedicated data teams | Longest build time |
| HubSpot + CRM integration | CRM-to-pipeline attribution | B2B with long sales cycles | Weaker ad-side attribution |
The most powerful setups we’ve seen combine GA4 or Adobe for front-end tracking with a cloud data warehouse for aggregation and Looker or Tableau for stakeholder dashboards. This gives you flexibility, scale, and clean data lineage.
Proper platform integration also means automating your tracking workflows through tools like Google Tag Manager, server-side tagging, or dedicated ETL (Extract, Transform, Load) pipelines. Manual data pulls break cadence and introduce inconsistency at precisely the moments when you need clarity most.
Automation best practices include:
- Use server-side tagging to future-proof against browser privacy restrictions
- Schedule automated exports from ad platforms to your data warehouse nightly
- Set up anomaly detection alerts so you catch data drops or spikes before they become costly surprises
- Build automated QA checks that flag broken tracking before reports are distributed
Understanding which marketing analytics platforms fit your current data maturity level is a prerequisite to platform selection, not an afterthought. If your team isn’t ready to operationalize Looker, starting there is a waste of budget and morale. Similarly, the right marketing automation tips can dramatically reduce the manual burden on analysts once your tracking infrastructure is solid.
When benchmarking automation platform options, focus on integration depth, not feature count. The platform that connects cleanly to your CRM, ad channels, and reporting layer beats the one with 200 features that don’t talk to anything you actually use. And once you’re set up, marketing performance analytics give you the visibility to stop guessing and start engineering growth.
Pro Tip: Involve your key end-users (paid media leads, CRM managers, finance analysts) in dashboard design from day one. A dashboard built without their input will get ignored within 90 days, guaranteed.
Putting it all together: Interpreting, benchmarking, and acting on data
Numbers without context are just noise. The final layer of effective metric analysis is interpretation: comparing your performance against credible benchmarks, spotting the patterns that signal real problems, and building a clear process for acting on what you find.
Here are the 2026 benchmarks every enterprise marketing team should have on hand.
| Channel / metric | 2026 benchmark |
|---|---|
| Google Ads Search CPA | $132 |
| Email open rate | 26.8% |
| TikTok engagement rate | 4.2% |
| Customer retention rate | 84% |
| B2B website conversion rate | 2 to 3% |
| SEO ROI | 748% |
“A healthy LTV to CAC ratio is 3:1 or higher. For B2B SaaS, the median CAC is $702 with an average payback period of 8.6 months. If your numbers sit outside these ranges, your growth model has a structural problem worth diagnosing immediately.”
Use these benchmarks as your first filter. If your Google Search CPA is sitting at $240, that’s not just a bidding problem. It signals potential issues with landing page quality, audience targeting, keyword intent alignment, or offer strength. Work backward from the number, not forward from assumptions.
A systematic interpretation process looks like this:
- Compare current performance to your internal baseline first. Is this metric trending up or down over the last four weeks? Four quarters?
- Layer in external benchmarks. Are you above or below industry standard for your channel and objective?
- Isolate the variable. If your CPA spiked, did CPCs rise, did conversion rate fall, or both? Isolating the variable stops you from pulling the wrong lever.
- Form a hypothesis. “We believe CPA increased because our landing page isn’t matching the new ad creative introduced in week three.”
- Test and measure. Run a controlled change, give it statistically significant traffic, and measure against your primary metric.
- Document your findings. Institutional knowledge that lives only in someone’s memory evaporates the moment that person changes roles.
Red flags to watch for: sudden drops in CTR on high-spend campaigns, MQL-to-SQL rate declining while total lead volume increases (a lead quality problem, not a volume win), and retention rate falling below 80% in subscription models. Each of these signals a different type of fix. Understanding how to read your essential digital metrics in sequence, rather than in isolation, is what separates reactive reporting from proactive strategy.
The uncomfortable truth about marketing metrics: less is often more
Here’s something we’ve observed across dozens of enterprise engagements: the teams with the most sophisticated dashboards are often the slowest to make decisions. There’s a real and consistent inverse relationship between tracking complexity and decision speed.
We’ve sat in marketing reviews where 47 metrics were on the screen and nobody could answer the simple question: “Are we growing profitably?” That’s a data problem, but not the kind you solve with more data.
The research is consistent: high-performing marketing organizations focus on 5 to 10 core metrics tied to clear objectives, tiered by function, and reviewed on disciplined cadences. They don’t track everything. They track the right things, relentlessly.
We call this radical metric simplicity. It’s a discipline, not a limitation. Choosing to own five metrics with genuine depth and accountability beats loosely monitoring fifty. And inside large enterprise structures where political pressure often drives dashboard bloat (“we need to show leadership we’re doing a lot”), radical simplicity requires genuine organizational courage.
Our practical advice: assign a named owner to every core metric. Not a team. A person. When CAC rises 15%, someone specific is responsible for diagnosing and responding. Accountability changes behavior at a fundamental level. This approach to tracking core marketing metrics with individual ownership is, in our experience, the single biggest driver of consistent metric improvement.
Here’s the reframe: fewer metrics, owned deeply, reviewed consistently, acted upon decisively. That is the growth machine. Everything else is noise management.
Accelerate your results with expert marketing analysis
Ready to apply disciplined marketing metrics to your next campaign? The gap between knowing what to measure and actually engineering a system that drives profitable growth is where most enterprises get stuck. We’ve helped brands close that gap with precision. Our performance creative case study shows how aligning creative strategy with the right metrics transformed brand-level outcomes, and our A/B testing success story demonstrates how systematic testing tied directly to measurable conversion goals. If you’re ready to build a metrics-driven strategy that your entire organization can act on, speak with our experts and let’s engineer something that actually moves the needle.
Frequently asked questions
What are the most important marketing metrics for enterprises?
Core metrics include Customer Acquisition Cost (CAC), Lifetime Value (LTV), ROMI, ROAS, MER, MQL-to-SQL rates, and customer retention rate, as these tie directly to revenue and sustainable growth.
How often should I review my marketing metrics?
Establish review rhythms with weekly performance check-ins, monthly goal reviews, and quarterly strategic audits to keep teams aligned and enable timely optimization.
How can I tell if a marketing metric is a vanity metric?
If a metric doesn’t directly indicate progress toward a key business objective or inform a budget or tactical decision, it’s functioning as a vanity metric and should be deprioritized.
What are the 2026 benchmarks for key marketing channels?
In 2026, Google Ads Search CPA averages $132, email open rates sit at 26.8%, TikTok engagement reaches 4.2%, and customer retention benchmarks at 84%.
How many metrics should I track per campaign?
Limit yourself to 2 to 3 primary metrics per campaign objective to prevent analysis paralysis and ensure your team stays focused on what genuinely drives results.
Recommended
- Harness Analytics to Transform Marketing Performance
- High-Impact Marketing Strategy Examples for Measurable Results
- Why conduct marketing audits? Optimize ROI and reveal growth
- Top 4 Marketing Analytics Platforms 2026
- Smart QR codes: boost campaigns with data and engagement
- Video marketing for e-commerce: ROI and strategies 2026 | QuickAdVideo Blog


Conversion Rate Optimization Transforms SaaS Content Into Profitable Advertising Collateral
.avif)

PictureFrames.com Sees Profitable Ecommerce Sales Growth Year Over Year


AdVenture Media Helps Jive Software Decrease Cost / SQL by 827%
Request A Marketing Proposal
We'll get back to you within a day to schedule a quick strategy call. We can also communicate over email if that's easier for you.
Visit Us
New York
1074 Broadway
Woodmere, NY
Philadelphia
1429 Walnut Street
Philadelphia, PA
Florida
433 Plaza Real
Boca Raton, FL
General Inquiries
info@adventureppc.com
(516) 218-3722
AdVenture Education
Over 300,000 marketers from around the world have leveled up their skillset with AdVenture premium and free resources. Whether you're a CMO or a new student of digital marketing, there's something here for you.
OUR BOOK
We wrote the #1 bestselling book on performance advertising
Named one of the most important advertising books of all time.
buy on amazon
OUR EVENT
DOLAH '24.
Stream Now.
Over ten hours of lectures and workshops from our DOLAH Conference, themed: "Marketing Solutions for the AI Revolution"
check out dolah
The AdVenture Academy
Resources, guides, and courses for digital marketers, CMOs, and students. Brought to you by the agency chosen by Google to train Google's top Premier Partner Agencies.
Bundles & All Access Pass
Over 100 hours of video training and 60+ downloadable resources
 view bundles →
.png)


